

In March, the COVID-induced quarantine sent me home, but more importantly, to my childhood Legos. What resulted was too much time, money, and effort spent entertaining some combination of my childhood and young adult self. By building a map. Out of Legos.
The process itself was fairly straightforward; I’ll outline it below.
Data Acquisition
Because Legos are inherently low resolution, low resolution data did the trick. I pulled USGS GTOPO30 30 Arc-Second DEMs from USGS EarthExplorer. I used Natural Earth’s state boundaries to clip down Idaho’s borders.
I also pulled the Natural Earth lakes and reservoirs data set to make sure that water features were represented.
Basemap Setup
After organizing my Legos and seeing the relative size of the color piles, I played with the DEM symbolization to show the colors in the ratios I was looking for. Given that I planned to use an equally deep layer of Legos for each band, I tried to keep the splits on the histogram at roughly equal values. The exact values here will need to differ for the terrain you are mapping and the proportions of Legos you have available.
I found that placing a nice, bright, border around the mapped area was helpful for Idaho in particular, where some of my white elevation band came up on oddly-shaped borders in the central part of the state. This helped differentiate the mapped area from the white background of the paper. It’s shown here in pink.

DEM symbolization adjustment in ArcGIS Pro
“Stencil” Print
My strategy for assembly was to print out the basemap at real size and trace each color on the final map. To do so, I created a layout in a custom size according to how big I wanted my finished map to be. In deciding on this size, it was useful to see which Lego base plates I had and how they could fit together to make a rough shape of the mapped area.
In ArcGIS Pro, I used the Print Layout tool to export the map, selecting:
- Printer Name – PDF
- Size – Letter
- Orientation – Portrait
- Tiling – Tile Oversized, All
The output should be a series of 8.5×11″ pages containing tiles of the stencil print, or just one page if your print fits within an 8.5×11″ box. It’s quick work with a printer some scissors, and some tape to turn these into clean tile templates to build off of.
Assembly
The assembly process was straightforward, but tedious. Placing each stencil tile on the base plate, I would trace the locations for each elevation band with my finger and place pieces accordingly. This often took some interpolation, iteration, and knowledge of local topography to accurately represent features or choose to most applicable color.

First, an outline in the lowest elevation band to establish general shape. 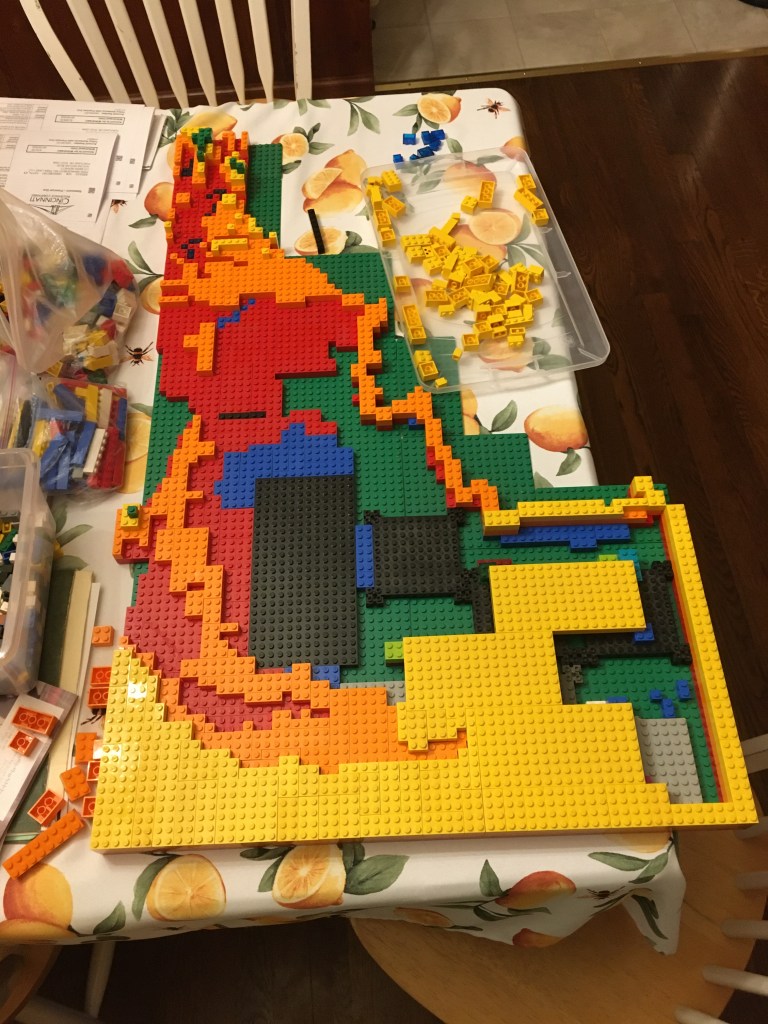
Next, filling in areas of higher elevation bands with filler colors. 
Finally, establishing large areas with larger Lego plates elevated on columns of few pieces below.
I’m sure everyone who takes on this challenge will find a different process to be helpful, but I typically found going tile by tile and elevation band by elevation band to be most effective.
This process took place over multiple weeks for a map of this scale (roughly 20×30″). Sanity breaks were required. Sore fingers ensued. This is much less playful than I remember.
Lakes!
I placed lakes “at grade”, in line with the surrounding topography, and used translucent blue pieces. I might try a solid or baby blue on my next try, though, as the translucent turned out fairly dark (see the reservoirs in the northern end of the state and lake in the southeastern corner of the third photo above).
Run out of pieces?
If you run out of pieces in one or more colors (as I did) and are too stubborn to downsize and start over (as I am), Lego offers the ability to order exact pieces using their Pick-a-Brick service. Be warned, shipping times were especially slow under COVID restrictions. Through some quick searches, I found a handful of Ebay vendors peddling pieces at slightly more competitive prices, with less control over piece and quantity selection.
The Finished Product
Show off your map to your friends, family, and whoever else needs to be convinced that Legos are for adults, too.
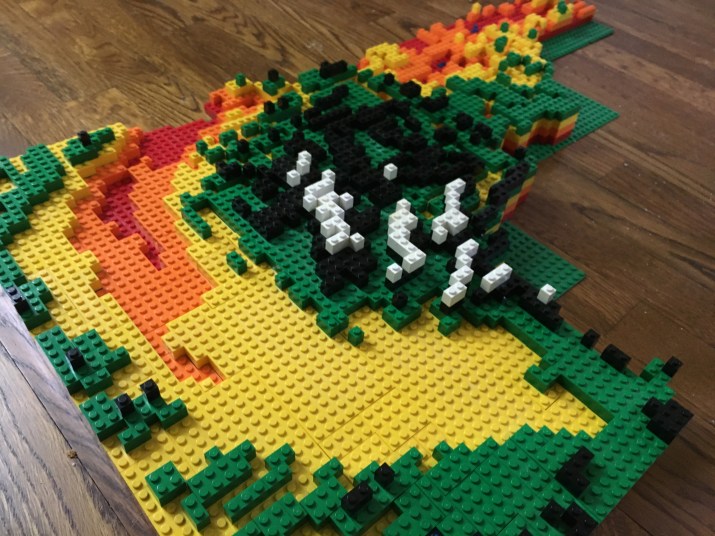
Oblique view of the Rockies and the Snake River Plane 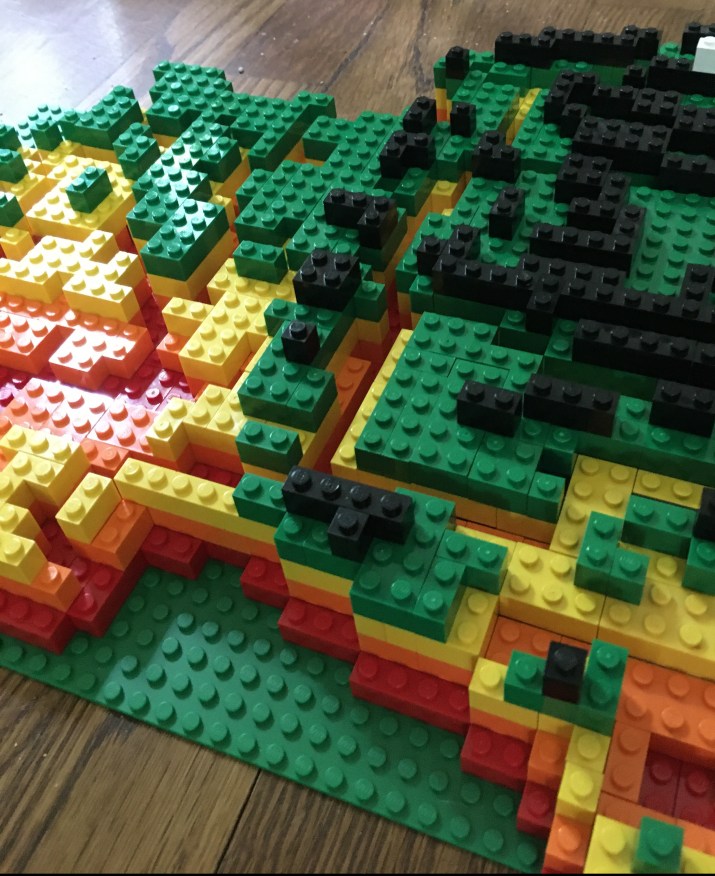
The Salmon River Canyon, Hells Canyon, and McCall area 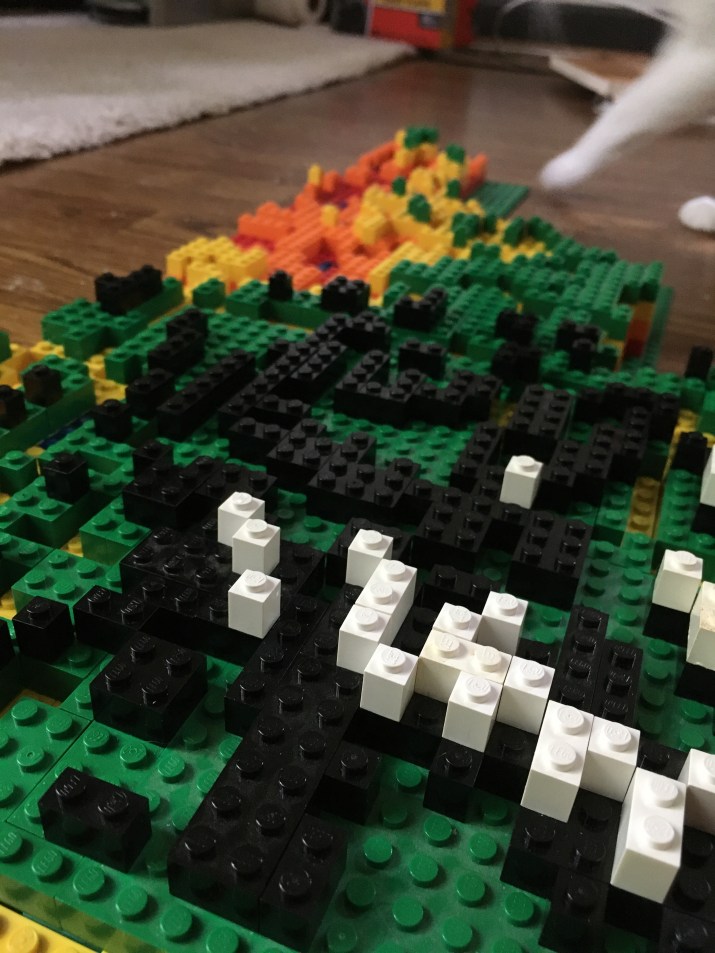
The Sawtooth and White Cloud mountain ranges 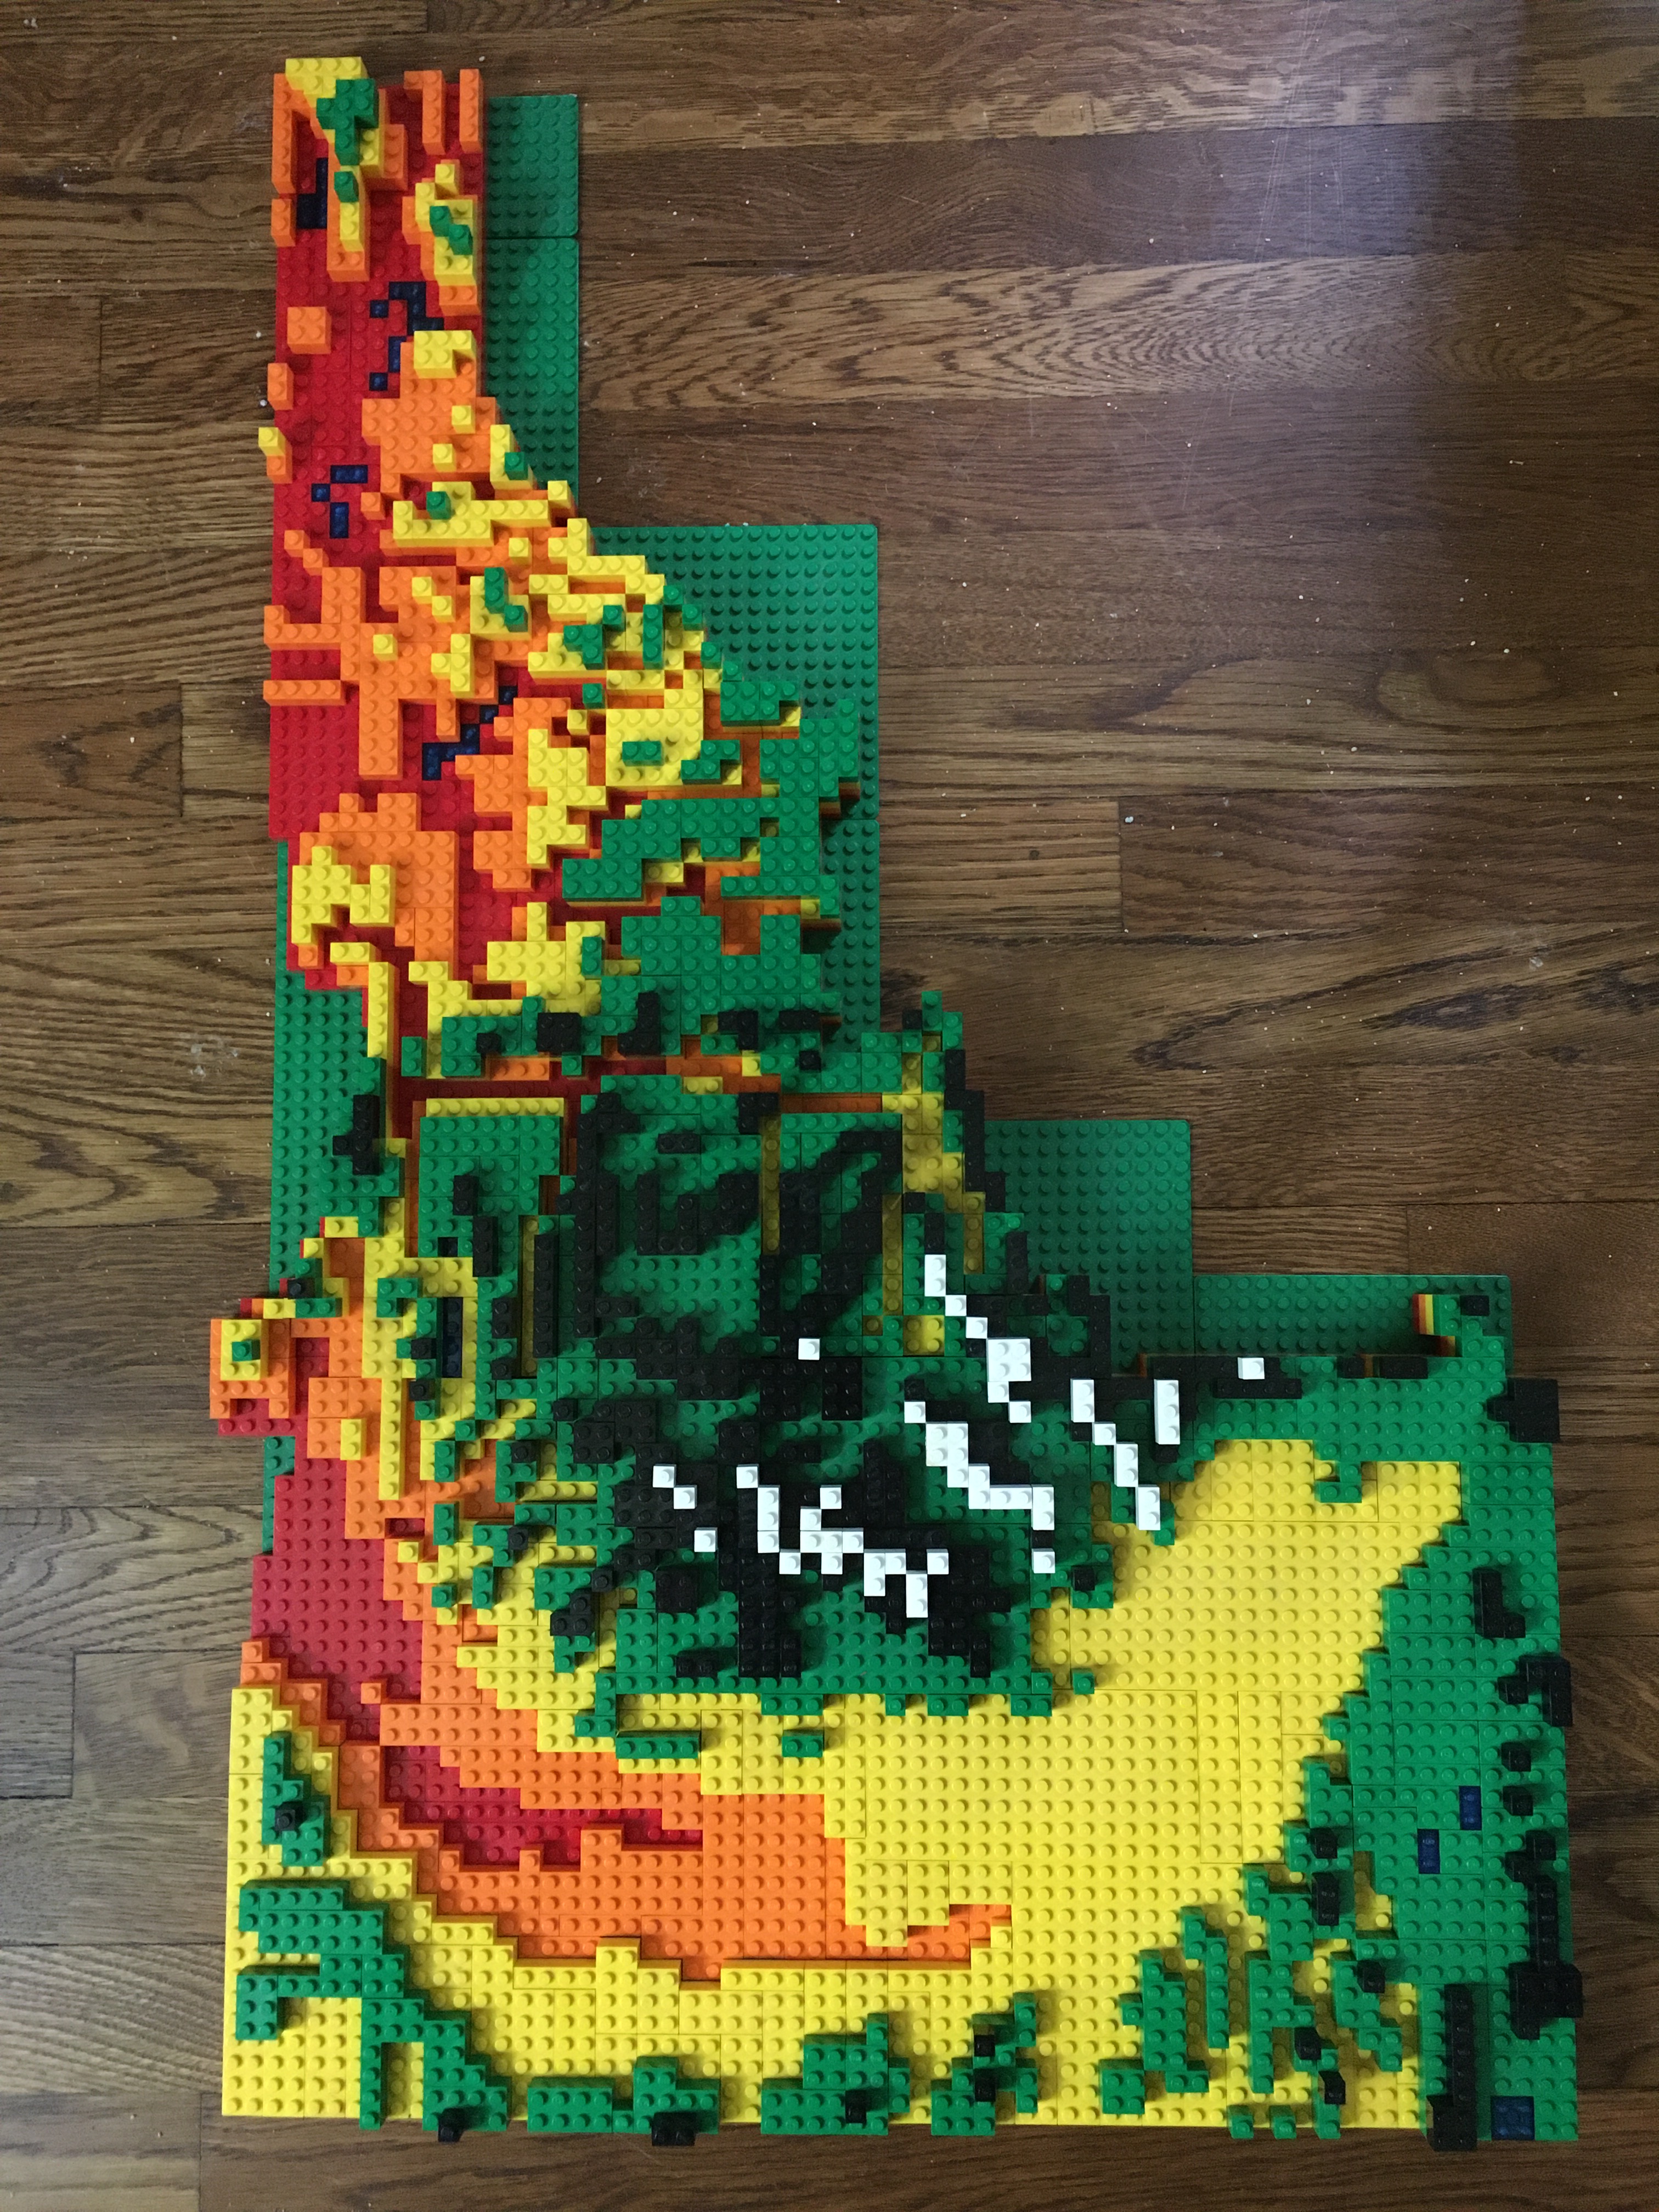

2 comments
Comments are closed.